net6.0
Flexchart是笛卡尔图表控件。 支持line, area, scatter, bubble, candle, column, bar 和 HLOCHLOC财务图表类型。
Published
Jul 17, 2026
3mo ago
Total Downloads
3.6K
3,646
Install
dotnet add package C1.Blazor.Chart.Cn --version 10.0.20261.98
| Product | Versions |
|---|---|
| .NET |
README
About
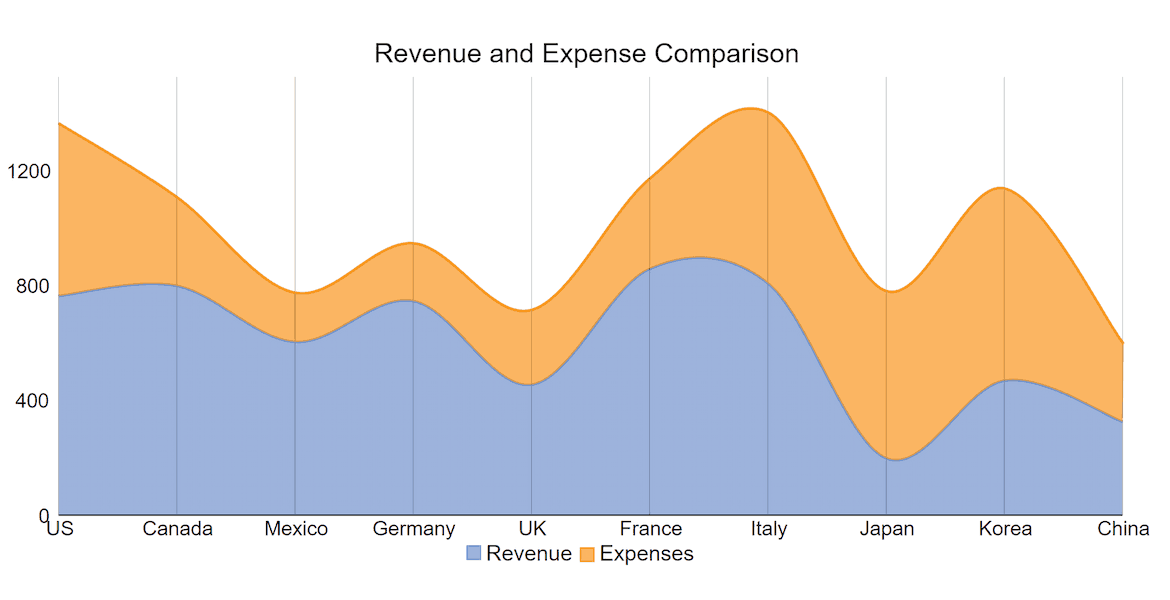
The ComponentOne Blazor FlexChart includes chart components for creating 2D charts such as bar, area, line, pie, treemap and scatter. Configure the charts down to the smallest detail with support for labels, line markers, legends and more.
 {: width="600px"}
Key Features:
- Supports 50+ popular chart types including clustered, stacked and composite plots.
- Supports pie and doughnut charts using the FlexPie component
- Supports polar and radar charts using the FlexRadar component
- Create hierarchical treemap and sunburst charts
- Create specialized charts like waterfall, histogram, error bar, Gantt, funnel, and bubble
- Display data labels, line markers, and legends to annotate the chart
- Supports stacking, trendlines, multiple axes, and multiple plot areas to help analyze the data
- Choose from 20+ built-in color palettes
- High performance SVG rendering for Blazor Server and WebAssembly applications
Learn more at developer.mescius.com/componentone.
Resources
Changes from Previous Version
No structural changes between v10.0.20261.37 and v10.0.20261.98.
Adoption Assessment
Assess this package against its supported frameworks, license, maintenance signals and dependency graph before making it a project standard.
No SPDX license expression is published. Review the license text and your organisation's policy before redistribution.Compatibility metadata lists 1 target framework; confirm the exact target used by your application.
Related Guides & Workflows
Learn how to evaluate, integrate, or audit this package in your .NET project.